Characteristics of FTA
Fault Tree Analysis (FTA) is a flexible method used to evaluate complex systems, from large-scale operations to smaller subsystems and individual functions. This analysis helps identify the factors that can lead to unwanted events by creating visual models that show how different causes combine to result in these events. Despite its detailed and structured nature, FTA is easy to learn and apply, making it a reliable and proven technique for ensuring safety over time.
Where does FTA fit in the development lifecycle?
Fault Tree Analysis (FTA) is integrated into the development lifecycle following the identification of top-level hazards or safety goals. It can be applied iteratively across all stages:
Concept Design: Initial planning and setting safety objectives.
System Design: Developing the system architecture.
HW/SW Development and Verification & Validation (V&V): Creating and verifying hardware and software.
System V&V: Comprehensive system testing.
Production Development: Final preparation for production and ongoing safety checks.
IEC 61508 standard references FTA as one of the recommended safety analysis techniques to identify failures. While it is not explicitly required, it is highly recommended due to its effectiveness in identifying potential causes of system failures, quantifying risks, and improving system design. By applying FTA iteratively, thorough analysis and effective risk mitigation are ensured for both high-level systems and lower-level components like subsystems and modules. This continuous application helps in maintaining a robust safety framework throughout the development lifecycle. Let’s break down this technique into easy-to-understand steps and symbols.
Inputs for Fault Tree Analysis
The inputs for Fault Tree Analysis (FTA) typically include:
System Design Information: Schematics, diagrams, and descriptions of the system architecture.
Historical Data: Past failure data, maintenance records, and incident reports.
Expert Knowledge: Insights from engineers, operators, and other subject matter experts.
Operational Data: Information on how the system is used, including environmental conditions and operational procedures.
Outputs of Fault Tree Analysis
The outputs of FTA are:
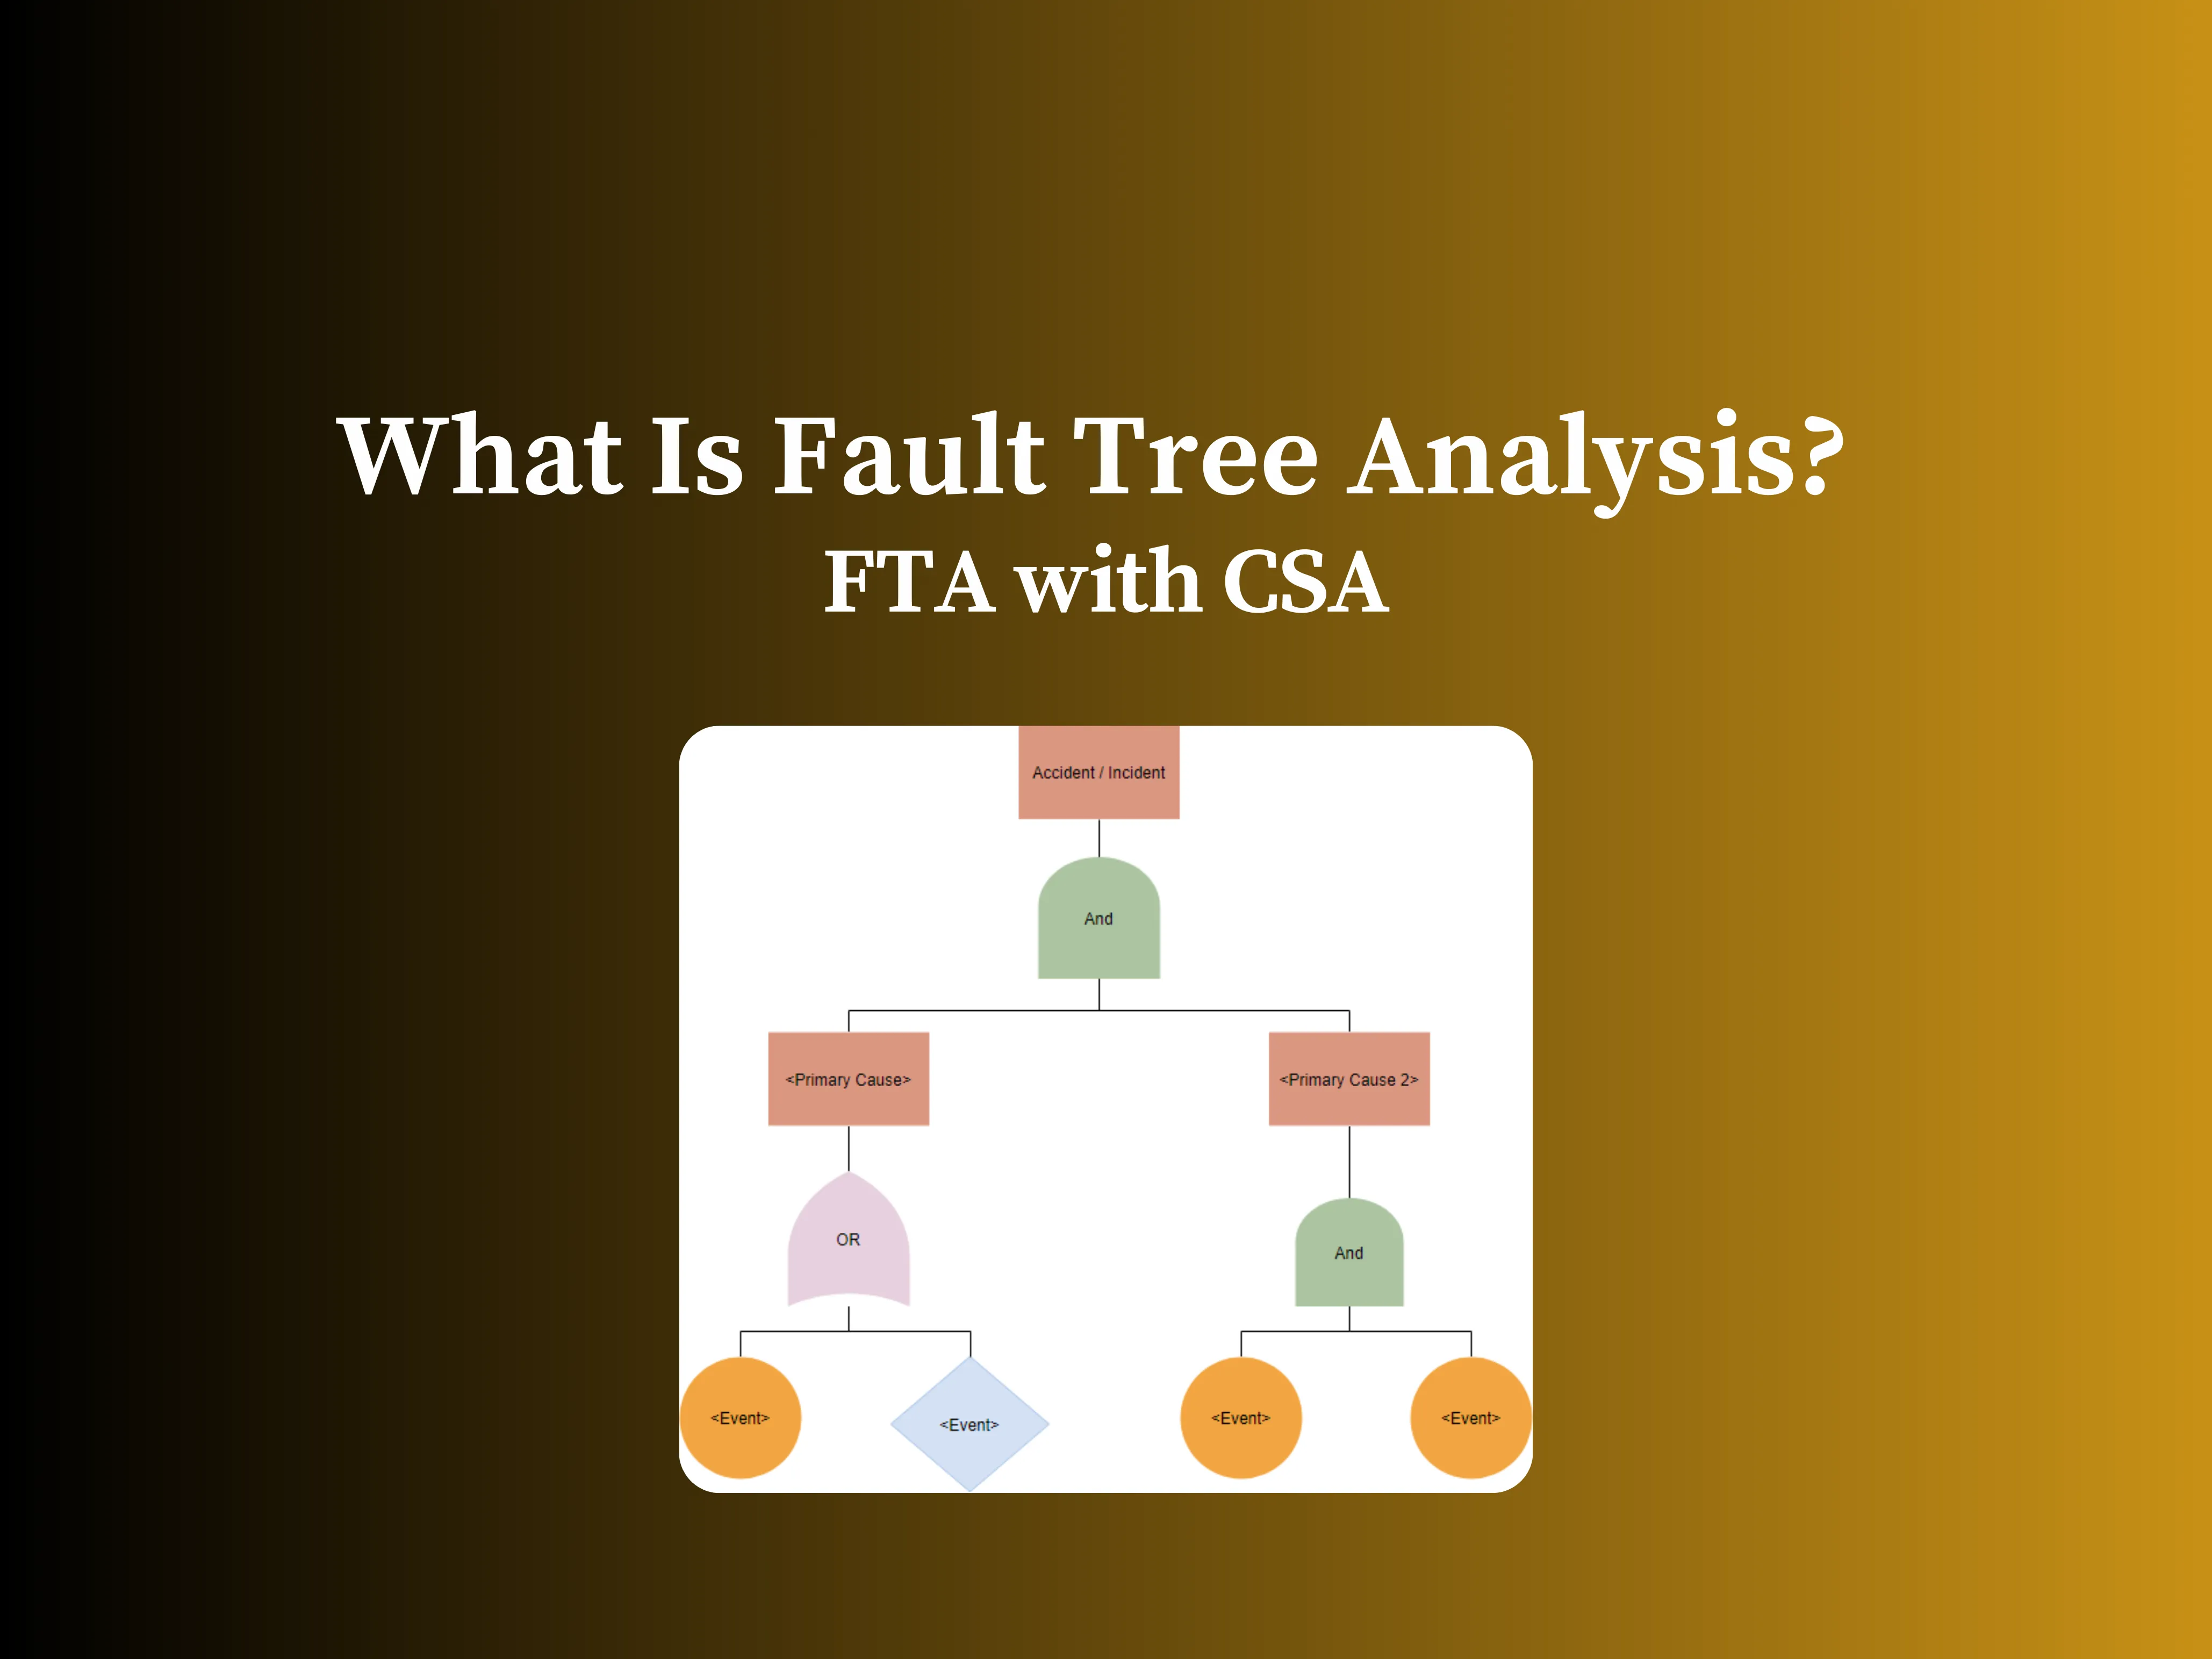
Fault Tree Diagrams: Visual representations of the relationships between different failure events and their causes.
Failure Probabilities: Quantitative assessments of the likelihood of different failure modes.
Critical Analysis: Identification of the most critical components or events that contribute to system failures.
Recommendations: Actionable insights for improving system design, maintenance, and operational procedures to mitigate identified risks.
Fault Tree Analysis Process Flow
Identify FTA Objective: Define the failure to be analyzed; align with decision maker's goals.
Define Fault Tree Top Event(s): Specify the failure event and its probability to be analyzed.
Define FTA Scope: Determine which failures and contributors are included; consider relevant design versions and historical data.
Define FTA Resolution: Set the detail level (e.g., function, sub-function, module, component).
Define FTA Ground Rules: Establish naming procedures for events and gates; specify modeling methods.
Construct Fault Tree: Build the fault tree using system schematics; include symbols to show relationships.
Evaluate Fault Tree: Conduct qualitative and quantitative evaluations to determine failure probabilities and contributing factors.
Interpret/Present Results: Translate results into actionable insights and implications for decision makers.
After completing the FTA, the next steps typically involve implementing the recommendations to improve system design, enhance maintenance practices, and adjust operational procedures. This is followed by verification and validation to test the system and ensure that the implemented changes effectively mitigate the identified risks. Continuous monitoring is also essential, involving regular reviews and updates of the FTA to account for any changes in the system or its operating environment, ensuring ongoing safety and reliability.
Symbols Used in Fault Tree Analysis
Some of the most frequently used symbols in an FTA are:
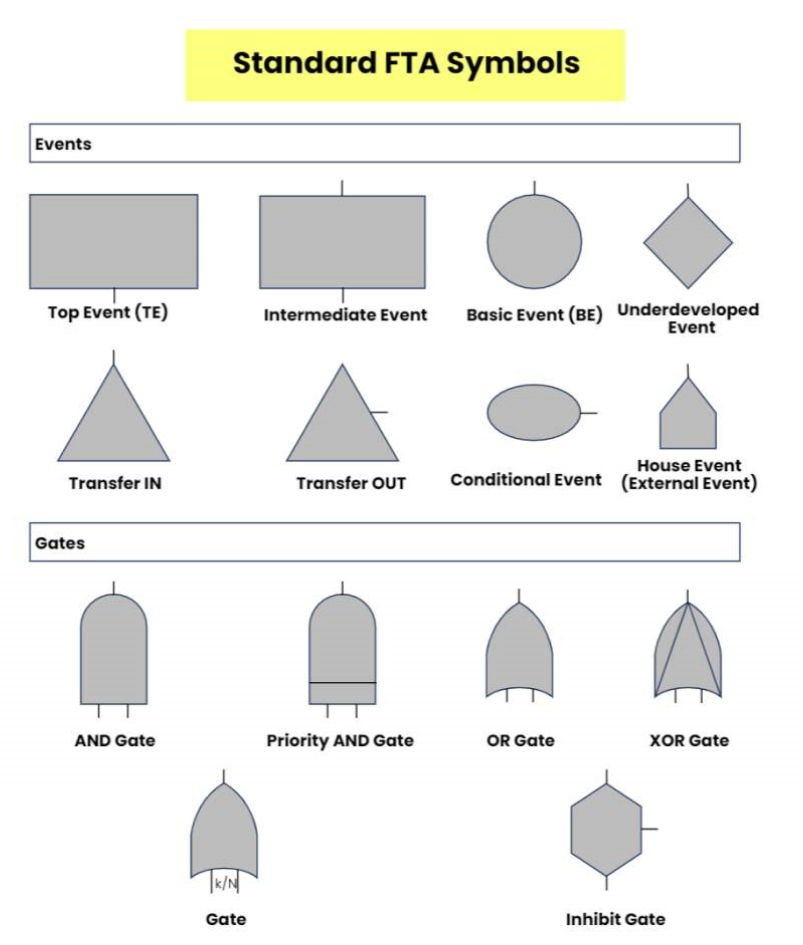
Event Symbols: These are the building blocks of fault tree diagrams, representing the events that lead up to higher-level gates and ultimately to the top-level gate. Examples include basic events and intermediate events.
Gate Symbols: Gates are logic symbols that represent events defined by one or more lower-level events. Common logic gates include:
AND Gates: Indicates that all input events must occur for the output event to occur.
OR Gates: Indicates that any one of the input events can cause the output event.
Transfer Symbols: Indicate connections to other parts of the fault tree, making complex diagrams easier to manage and understand.

Figure 1: FTA Symbols
Types of Fault Tree Analysis: Qualitative vs. Quantitative
Qualitative FTA
Identifies single-point or residual faults and multiple-point faults (perceived, detected, or latent).
Evaluates the effectiveness of diagnostic measures.
Demonstrates freedom from dependent failures.
Serves as a good cross-check against Failure Mode and Effects Analysis (FMEA).
Quantitative FTA:
Provides a comprehensive assessment of component failure rates to determine top-event probability.
Identifies probabilistic weak links in the design.
Assists with strategic resourcing.
Preferred for smaller, simpler fault trees, limited to basic AND and OR gates.
While qualitative FTA is often favored for complex systems due to its broader applicability, quantitative FTA excels in more straightforward scenarios, offering detailed numerical insights.
Guidelines for Effective Fault Tree Construction
Define Boundaries: Clearly define the scope and boundaries of the analysis.
Identify Top Events: Pinpoint the key events to analyze.
Use a Top-Down Approach: Identify immediate causes using a structured, top-down method.
Detail Intermediate Levels: Continue to identify causes through intermediate levels of complexity.
Terminate at Primary Events: Conclude the analysis with primary event types.
Ensure Complete Descriptions: Provide clear and complete descriptions for all events and causes.
Use Distinctive Names: Assign unique and distinctive names to each event and cause.
By following these steps and guidelines, you can effectively use Fault Tree Analysis to improve the safety and reliability of complex systems. This method not only helps in identifying potential failure modes but also in prioritizing risk mitigation efforts, making it an indispensable tool in safety analysis.
